airsyn design
introduction
The AirSyn Monitor is a sensor device that uses 7 sensors to detect and measure various gas pollutants, such as Carbon monoxide and excess cooking gas, in your environment.
The AirSyn Monitor comes with a software that detects the presence of various gaseous pollutants and the level of pollution in the environment. It also alerts individuals of any potential hazards in the surrounding area.
role
product designer
User research, Competitor research, user persona, information architecture, user flows, wire frames, prototyping, visual design, testing
duration
June 2022 - ongoing
Tools used
Figma, google forms, google docs, whimsical
problem statement
Users of the air monitoring software reported difficulty in understanding the data provided by the software and the hardware device. They also reported difficulty in interpreting the data and taking action based on the information provided. Additionally, users had difficulty in setting up the hardware device properly and connecting it to the software
background
Air pollution is a major public health concern, with poor air quality linked to a range of health issues such as respiratory problems, heart disease, and cancer. To address this issue, our team developed an air monitoring software that tracks and reports on the quality of the air in a specific location. The software is used in conjunction with a hardware device that detects and measures various pollutants in the air.
understanding the problem
To understand the problem, we conducted user research by interviewing users and observing them using the software and hardware device. We found out the following;
- Users had a difficult time understanding the data provided by the device, as the information was presented in a confusing and technical manner.
- Additionally, users had trouble interpreting the data and taking action based on the information provided.
project vision and solutions
- Make it more user-friendly and easier to understand.
- Used clear and simple language to present the data.
- Added visual aids to help users interpret the information.
- Create a step-by-step guide for setting up the hardware device and connecting it to the software, to make the process easier for users.
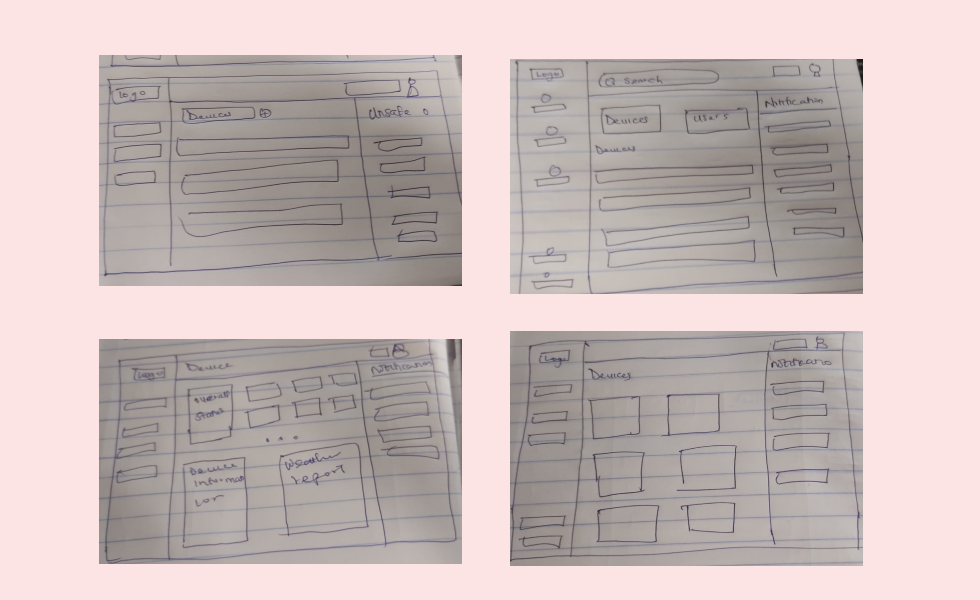
To begin, we conducted market research on competitors to explore what was currently available in the market and to gather inspiration for features we liked in existing platforms. I then led a 15-minute sketching session to allow team members to visually communicate their ideas for the solution.
defining the mvp
From the sketching sessions, it became clear that there were shared themes in our product vision. The following key user stories were identified:
- Find devices: Users can locate the various AirSyn devices that are registered to them.
- Check for pollutants: Users can view the pollutants present and the level of pollution in the environment on their dashboard.
- Creating a design system: Having a design system in place helps to ensure that the overall visual identity and user experience remains consistent throughout the platform.
- Generate reports: Users can generate reports for various pollutants and track their levels over a specific period of time.
designs
Based on our sketches, I began designing the main screens, and then moved on to the styling. We decided to use a dark theme for the design.
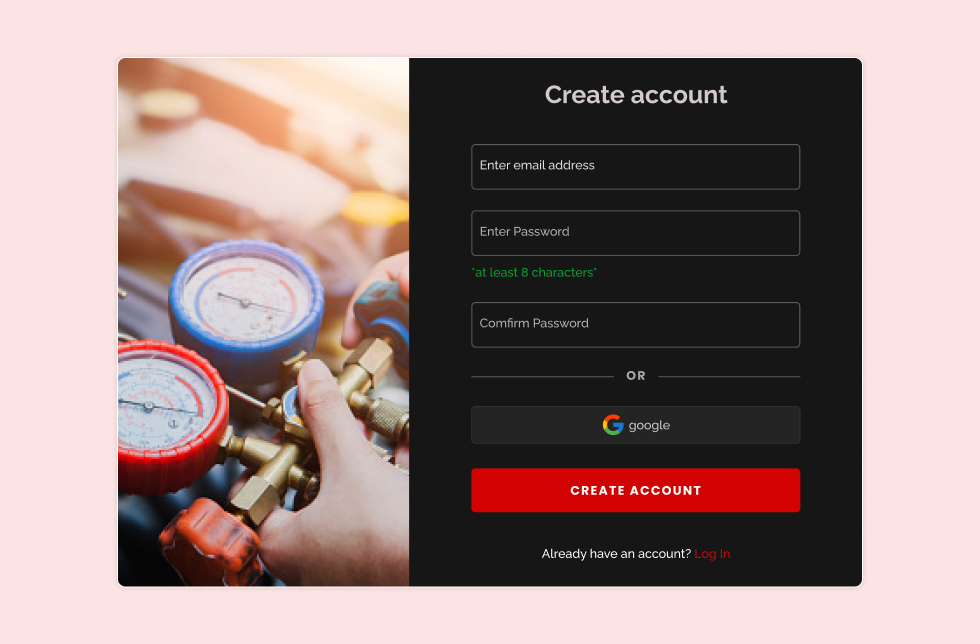
registration
For the registration screens, I created a straightforward sign-up and login form.
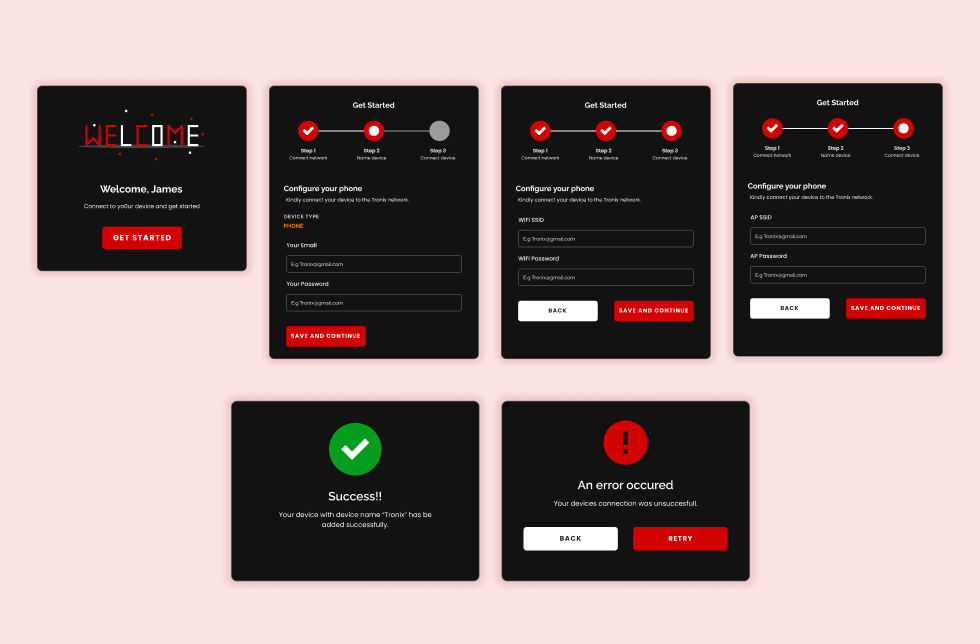
onboarding
The process of onboarding users to set up their devices was made more user-friendly by breaking it down into smaller, manageable modules to avoid overwhelming the user.
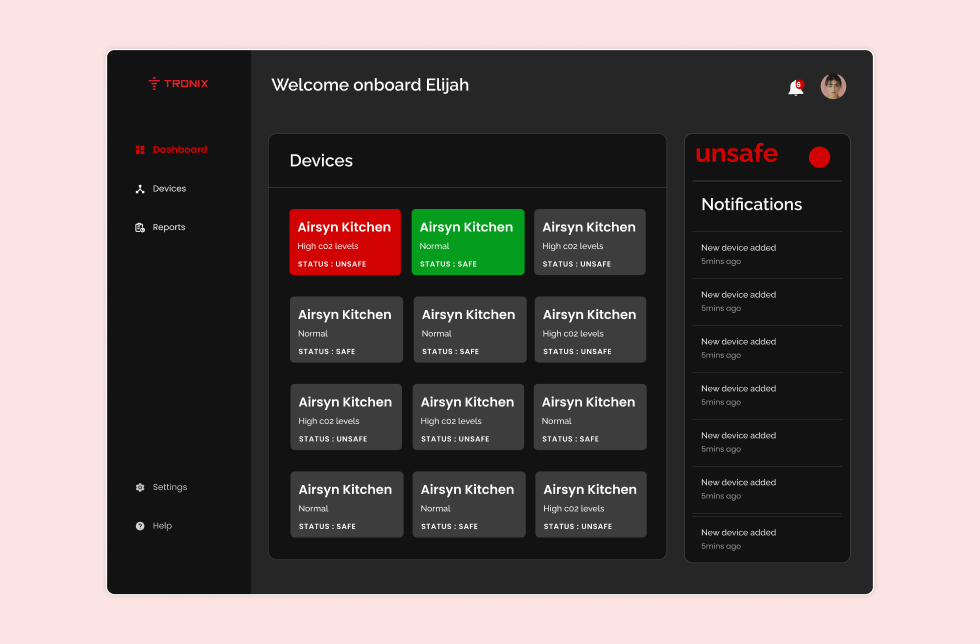
dashboard
The dashboard displays information about all devices, including which ones are active, safe, and unsafe, as well as the overall status of the environment and any notifications.
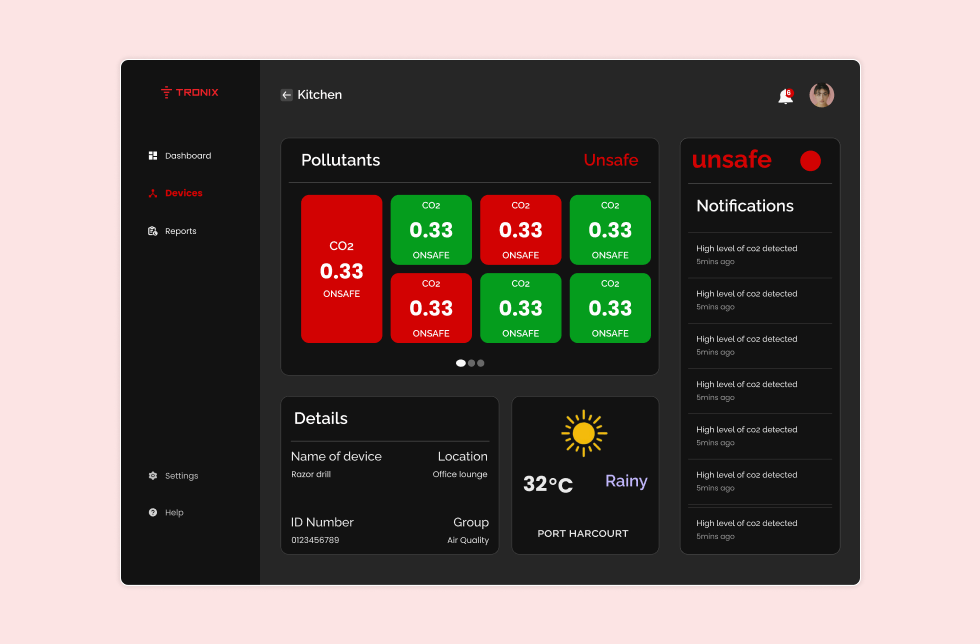
devices
The devices display information about the pollutants measured by a specific device, including its location and status, as well as any related notifications.
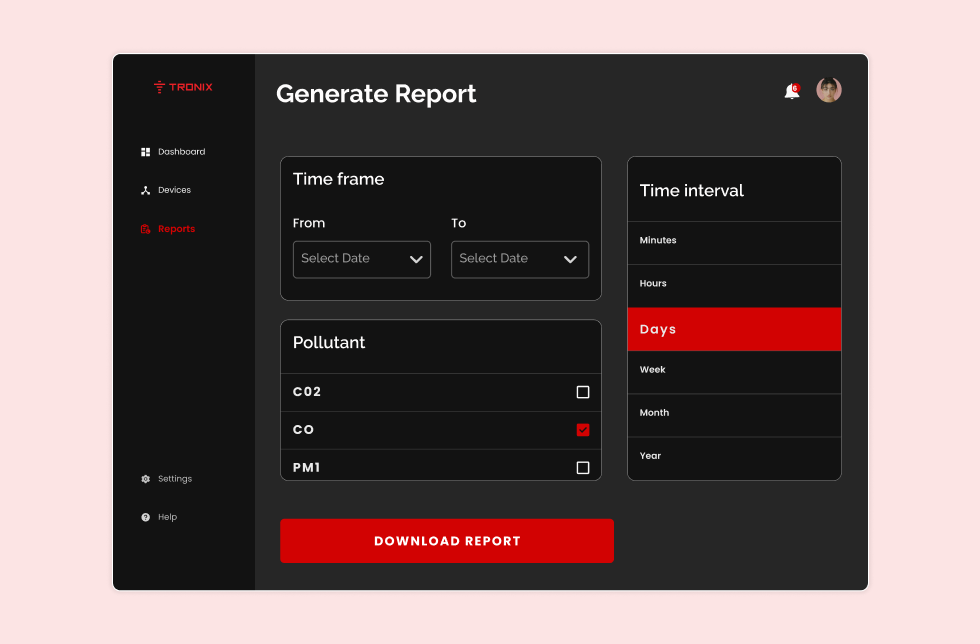
report
The report feature enables users to generate reports on one or multiple pollutants at various time intervals and export them as PDFs.
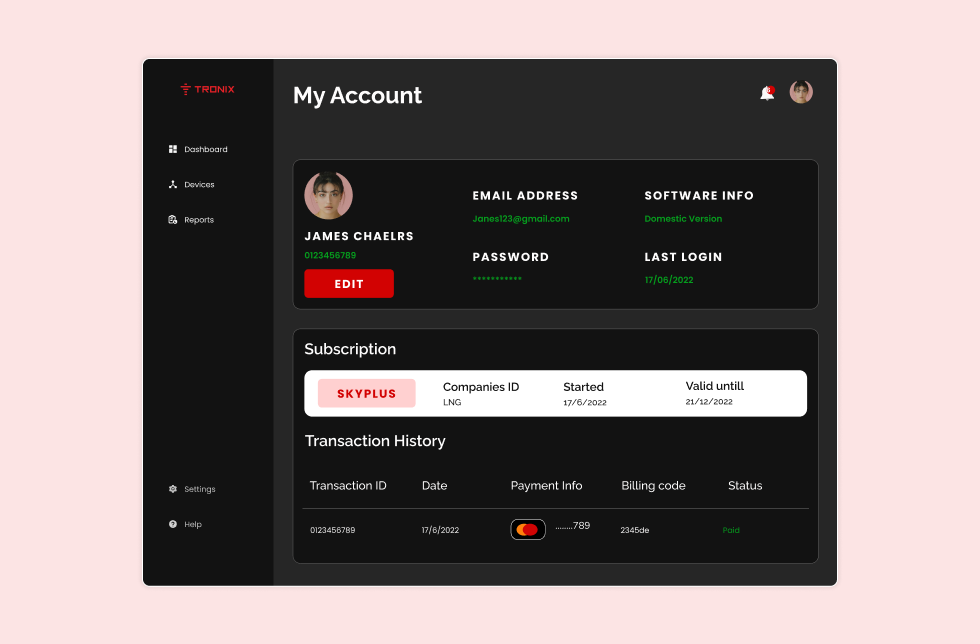
profile
The profile section holds information about the users and their subscription details.
evaluation
We evaluated the effectiveness of the redesign by conducting user testing with a group of users. We found that users were able to;
- Understand the data provided by the device more easily.
- Had an easier time interpreting the information and taking action based on it.
- Users found the step-by-step guide for setting up the hardware device helpful.
conclusion
Our redesign of the air monitoring software and the addition of a step-by-step guide for setting up the hardware device improved the user experience for users. By making the data provided by the device more understandable and actionable, we were able to help users take steps to improve the air quality in their location.